Data-Driven Conveyor Layout Design for Benelux Warehouses
Harnessing data analytics is crucial for designing and optimizing conveyor system layouts in modern Benelux warehouses. This data-driven approach moves beyond traditional design, enabling logistics managers to create highly efficient, scalable, and cost-effective material handling flows.
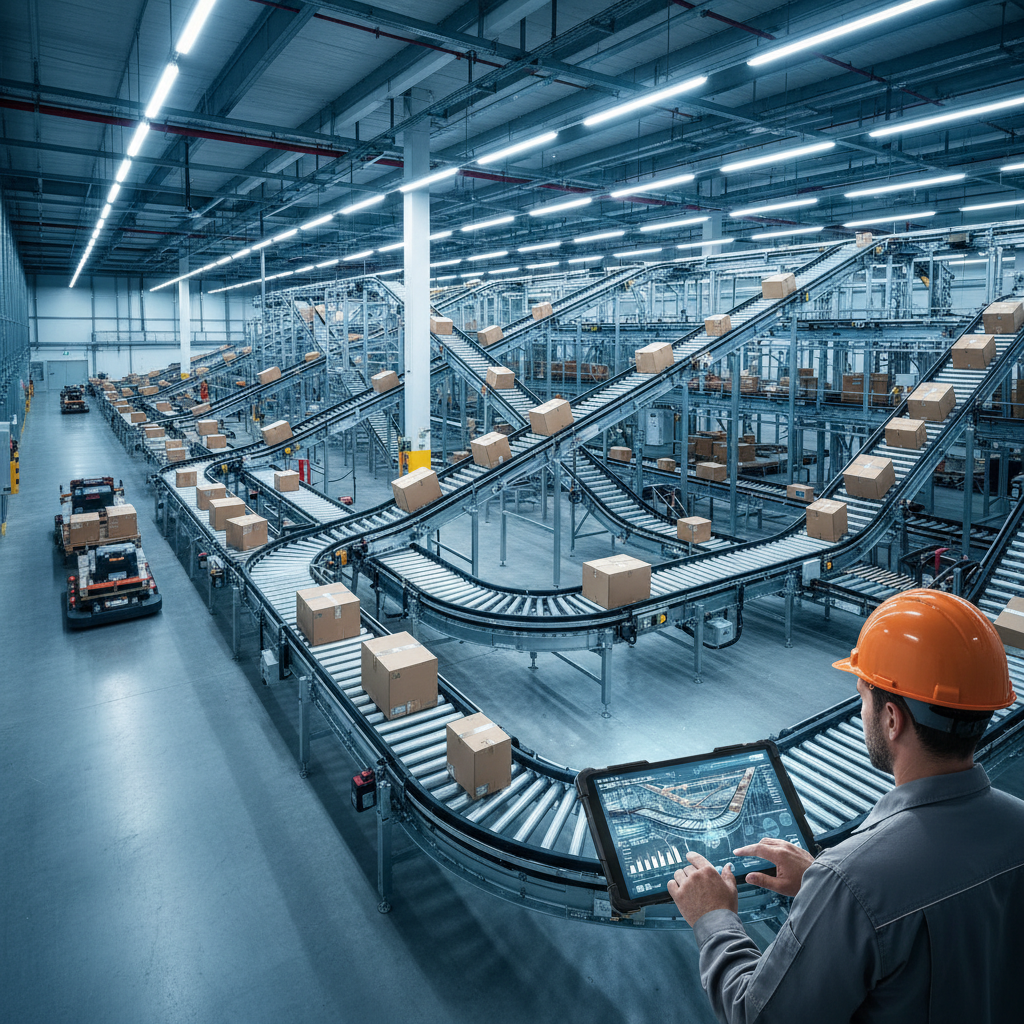
Key numbers
| Metric | Typical range (EU 2026) | Notes |
|---|---|---|
| Operational Cost Reduction | 15-30% | Achieved through lower energy use and reduced manual intervention. |
| Throughput Increase | 10-25% | Resulting from eliminating bottlenecks and optimizing flow paths. |
| System Payback Period | 2-4 years | For projects with a CapEx between €500k and €2M. |
| Simulation Accuracy | >95% | In predicting system throughput and identifying potential bottlenecks. |
| Energy Consumption Reduction | 10-20% | Compared to non-optimized or oversized conveyor systems. |
| Design Project Duration | 3-4 months | From data collection to a fully simulated and validated layout design. |
In the bustling logistics landscape of the Benelux—Europe's premier distribution hub—every square meter and every second counts. As e-commerce demand continues to surge, warehouse managers are under immense pressure to increase throughput and efficiency. Simply adding more conveyor lines is no longer a viable solution. The key to unlocking next-level performance lies not in more hardware, but in smarter design, driven by data analysis.
Definition
Data-driven conveyor layout optimization is the practice of using historical and real-time operational data to design, model, and validate a conveyor system's physical arrangement for maximum efficiency, throughput, and scalability. It replaces traditional, experience-based design with a quantitative approach focused on measurable performance indicators.
Why Traditional Conveyor Layout Design Falls Short
Historically, conveyor layouts were often designed based on a combination of experience, CAD drawings of the empty building, and static calculations based on peak capacity. This approach has several inherent weaknesses in today's dynamic environment:
- Static Assumptions: It often fails to account for hourly or seasonal fluctuations in order volume and product mix. A system designed for a generic "peak day" may be inefficient and costly to run during average periods.
- Hidden Bottlenecks: Without flow analysis, it's easy to create unforeseen bottlenecks at merges, sortation points, or packing stations that only become apparent after the €500,000+ system is installed.
- Over- or Under-Specification: A lack of precise data often leads to over-engineering "just in case," resulting in higher capital expenditure (CapEx) and energy costs. Conversely, under-specification can cripple an operation's ability to scale.
- Poor Adaptability: Traditional layouts can be rigid, making it difficult and expensive to adapt to new product lines, packaging sizes, or fulfillment strategies like micro-fulfillment.
Key Data Points for Conveyor Layout Analysis
Effective data analysis begins with collecting the right information. Most of this data can be extracted from your existing WMS (Warehouse Management System) and ERP (Enterprise Resource Planning) systems. The goal is to build a comprehensive picture of your material flow DNA.
Critical Data Categories
- Order & SKU Data: This includes order profiles (items per order, lines per order), SKU velocity (ABC analysis), and a full product master with dimensions (L x W x H in mm) and weight (kg) for every item. This data determines the required capacity and type of conveyor (e.g., roller vs. belt).
- Throughput & Flow Data: Analyzing peak and average throughput rates, measured in CPH (cases per hour), is crucial. It’s also vital to map the physical flow paths from receiving to storage, picking, packing, and shipping to understand travel distances and times.
- Process Timings: How long does each step take? Measure dock-to-stock times, picking and packing durations per order type, and cartonization times. This data reveals where accumulation and buffering are needed.
- Facility Constraints: This includes the building layout (column spacing, ceiling height), available power, and the location of functional areas like docks, staging areas, and value-added service (VAS) zones.
The Data-Driven Design Process: A Phased Approach
Optimizing a layout with data is a structured process that moves from raw information to a validated, high-performance design.
Phase 1: Data Collection & Cleansing
The first step is to extract at least 6-12 months of operational data from your systems. This data is often "dirty," containing anomalies or gaps. It must be cleansed and standardized to form a reliable foundation for analysis.
Phase 2: Baseline Modeling & Simulation
Using simulation software, a digital model of the *current* layout is created. The collected data is then used to run this model, which validates its accuracy by comparing the simulation's output (e.g., throughput, bottlenecks) to real-world performance. This digital twin forms the baseline.
Phase 3: Scenario Analysis & Optimization
This is where the optimization happens. Different layout scenarios are designed and tested in the simulation environment. What if we move the packing station? What if we use a spiral conveyor instead of a long incline belt? What if we introduce a new sortation loop? The software allows you to test dozens of "what-if" scenarios, measuring the impact of each on key metrics without any physical investment. You can project performance for Black Friday peaks or future growth of 20% year-on-year.
Comparing Data-Driven vs. Traditional Layouts
The difference between a data-driven approach and a traditional one is stark, impacting everything from cost to long-term performance.
| Attribute | Traditional Layout Design | Data-Driven Layout Design |
|---|---|---|
| Basis for Design | Experience, rules of thumb, static peak calculations. | Dynamic operational data, simulation, and flow analysis. |
| Bottleneck ID | Reactive; discovered after go-live during peak stress. | Proactive; identified and engineered out during simulation phase. |
| Cost Efficiency | Risk of over-spec (higher CapEx) or under-spec (lost revenue). | "Right-sized" system; typical TCO reduction of 15-30%. |
| Implementation Risk | High. The design is an educated guess until proven live. | Low. Performance is validated with >95% accuracy before purchase. |
| Flexibility | Often rigid and difficult to modify without major disruption. | Designed for scalability and adaptability based on future projections. |
| Typical Throughput | Meets initial static target (e.g., 2,000 CPH). | Sustains higher dynamic throughput (+15-25%) by eliminating micro-stops. |
Benelux Context: Specific Challenges and Opportunities
Applying data analysis to conveyor design is particularly impactful in the Benelux (Belgium, Netherlands, Luxembourg) for several reasons:
- High Space & Labor Costs: With prime logistics real estate near hubs like Antwerp, Rotterdam, and Schiphol being scarce and expensive, layouts must be dense. Data helps design compact, multi-level systems using spiral conveyors and clever routing to maximize the use of vertical space. With warehouse labor costs often exceeding €40 per hour, automation ROI is critical.
- Gateway to Europe: The region's role as a continental distribution hub means warehouses handle an incredibly diverse mix of goods, destinations, and carrier requirements. Data analysis is essential for designing flexible sortation systems that can handle this complexity efficiently.
- Scalability is Key: Many companies in the region experience rapid growth. As noted in a recent Easy Systems analysis, company growth often outpaces the scalability of their internal processes. A data-driven design process allows you to model 3-5 years of projected growth, ensuring the conveyor system you install today won't be obsolete in two years.
The Future: AI and Real-time Optimization
The evolution of data analysis in logistics is heading towards real-time application. The rise of the Industrial Internet of Things (IIoT) and AI is paving the way for "self-optimizing" conveyor systems. Imagine a warehouse where the conveyor system, guided by a WES (Warehouse Execution System), automatically reroutes flow in real-time to avoid a sudden bottleneck, or where AI predicts a motor failure on a key belt conveyor and diverts packages before it even happens. This level of dynamic optimization, built on a foundation of solid data analysis, is the future of material handling.
Easy Systems: Your Partner in Data-Driven Conveyor Design
At Easy Systems, we believe that a successful conveyor system is born from data, not assumptions. Our engineering process is deeply rooted in analyzing your unique operational data to design a solution that is efficient, scalable, and provides a clear return on investment. We leverage our deep experience in the Benelux market to translate complex data into practical, high-performance conveyor layouts. From initial data collection to final simulation and implementation, we partner with you to ensure your material handling system is a strategic asset, perfectly optimized for the challenges and opportunities of your specific business.
Frequently asked questions
What data is most important for optimizing a conveyor layout?+
The most critical data includes order profiles, SKU master data (dimensions, weight), and throughput rates (CPH). To ensure model accuracy, analysis should cover at least 12 months of historical order data and include over 95% of the active SKU catalogue. This provides a robust foundation for simulation.
How much can data analysis reduce conveyor system costs in the Benelux?+
Benelux warehouses can typically see a 15-30% reduction in lifetime operational costs (OpEx). This is achieved through right-sized motors and belts, which cuts energy use by 10-20%, and minimized wear from smoother flow, which reduces maintenance needs. It also avoids costly post-installation modifications.
Can data-driven design be applied to existing conveyor systems?+
Absolutely. By collecting data from your current system's PLC and WMS, you can create a 'digital twin' of your operation. This model reveals hidden bottlenecks, allowing for targeted upgrades—like adding a new sortation lane or buffer zone—that can increase throughput by 10-20% without a complete overhaul.
What is the typical ROI for a conveyor optimization project?+
The Return on Investment (ROI) for a data-driven conveyor optimization project in Europe is typically 2 to 4 years. For a project with an initial CapEx of €750,000, savings in operational efficiency, reduced labour costs, and increased throughput can generate annual returns of over €250,000, ensuring a rapid payback.
How does simulation improve the design process?+
Simulation validates a design's performance under various scenarios (e.g., Black Friday peaks) before purchase. By running models that process millions of order lines, teams can guarantee the system will achieve its target CPH, often above 6,000 cases per hour for automated sites, with over 95% accuracy and no physical prototypes.
How long does a data-driven design project take?+
A typical project for a medium-sized warehouse (10,000-20,000 m²) has two main phases. Data collection and analysis takes 3-5 weeks. The subsequent simulation and design phase takes another 4-6 weeks. This allows for a validated design to be ready for tender within 3 months, significantly accelerating the project timeline.

The Easy Systems engineering team designs, integrates and commissions conveyor systems and warehouse automation across Belgium, the Netherlands and Luxembourg. Combined experience covers roller and belt conveyors, sorters, AGV/AMR fleets, AutoStore, shuttle AS/RS and WMS/WCS integration for distribution centers and e-commerce fulfillment operations.
- Conveyor design (roller, belt, modular plastic)
- Sortation & merge logic
- AGV / AMR fleet integration
- AutoStore & shuttle AS/RS
- WMS / WCS integration