Predictive Analytics for Conveyor Throughput: Boost Operational Efficiency in Benelux Distributionscentra
Leverage predictive analytics to transform your conveyor system's performance. This guide explains how to forecast throughput, identify potential bottlenecks, and optimize operational efficiency for distribution centers in the Benelux region, ensuring higher productivity and lower costs.
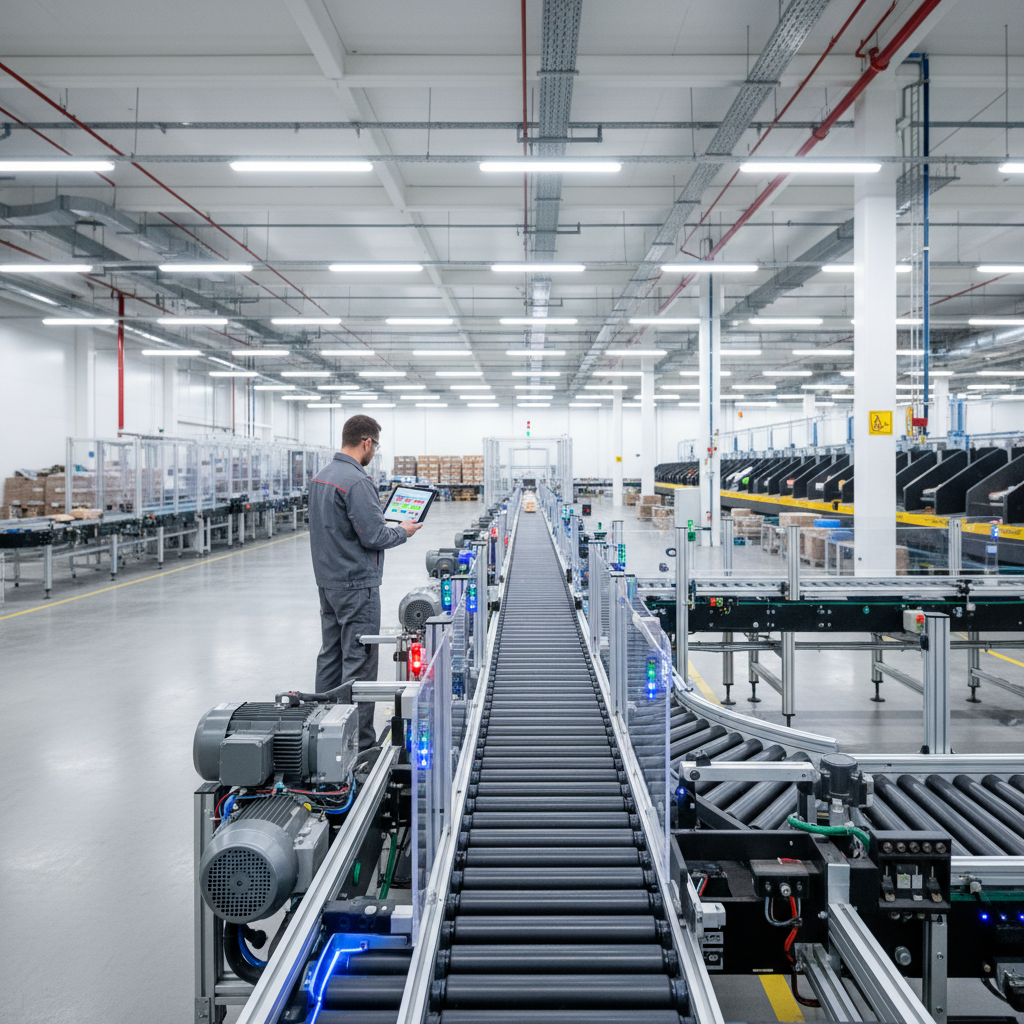
In the high-stakes, fast-paced logistics landscape of the Benelux, every second and every square meter counts. Distribution centers are the beating heart of this network, and their conveyor systems are the arteries. When they slow down, the entire operation suffers. While traditional maintenance focuses on fixing what's broken, a more advanced approach is gaining traction: using predictive analytics to forecast and optimize conveyor throughput, turning reactive measures into a proactive strategy for peak efficiency.
Definition
Predictive analytics for conveyor throughput is the practice of using advanced statistical models and machine learning on historical and real-time operational data to forecast the flow of goods through a conveyor system. It aims to anticipate bottlenecks, predict system capacity under various conditions, and proactively manage resources to ensure smooth and efficient operations.
Why Predictive Throughput Analytics Matters in the Benelux
The Benelux region—Belgium, the Netherlands, and Luxembourg—is one of Europe's most concentrated logistics hubs. With major ports like Rotterdam and Antwerp and a dense network of roads and distribution centers, competition is fierce. In this specific context, predictive analytics isn't a luxury; it's a critical competitive differentiator.
European labor costs, particularly in the Benelux, are among the highest in the world. An optimized conveyor system that avoids unexpected slowdowns means that a warehouse can process more orders with the same headcount. A 15% increase in throughput without adding staff directly translates to a significant reduction in cost per order. Furthermore, the proximity to major consumer markets demands high service levels, making on-time delivery metrics like OTIF (On-Time-In-Full) paramount. Predictive analytics helps guarantee that a promised next-day delivery isn't compromised by an unforeseen conveyor jam during the evening peak.
Key Data Sources for Accurate Throughput Prediction
An accurate predictive model is only as good as the data it's fed. To effectively forecast conveyor throughput, a system needs to integrate data from multiple sources across the warehouse. The most critical inputs include:
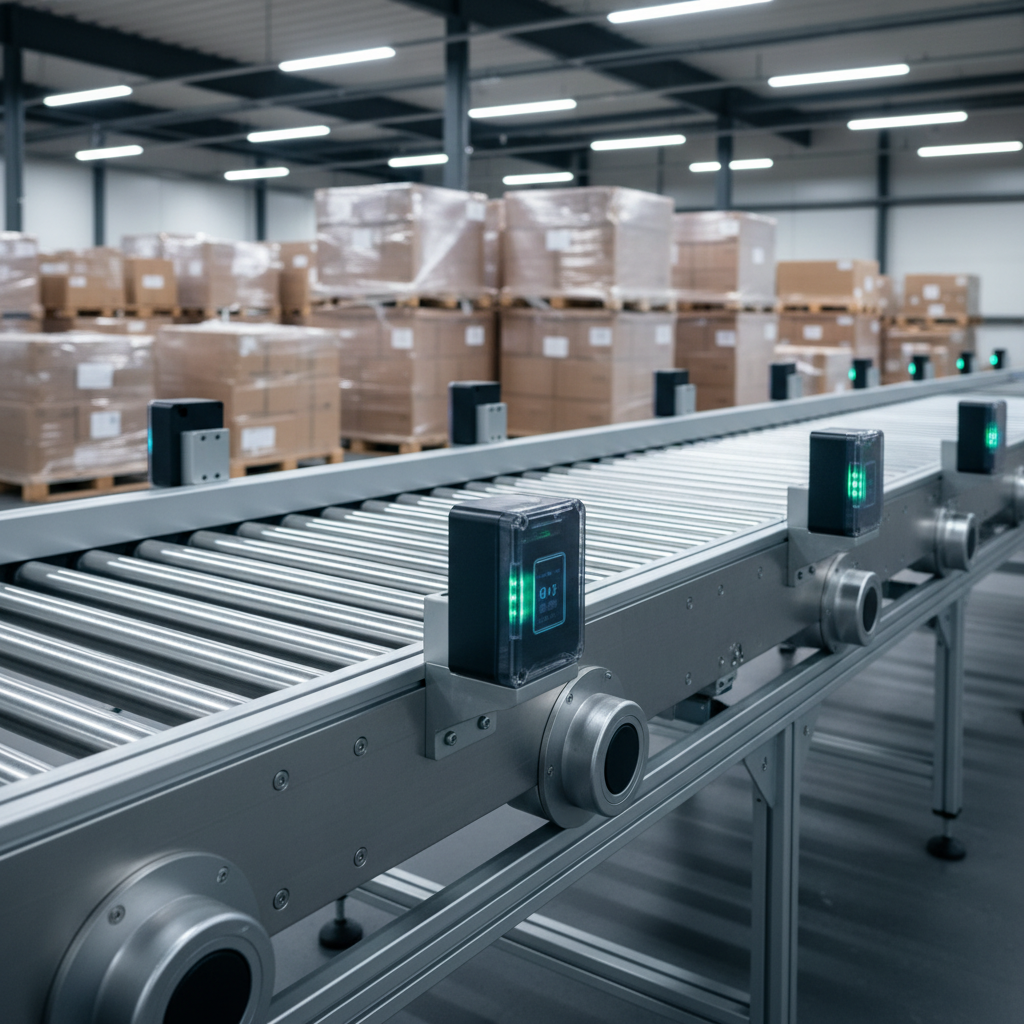
- Conveyor Sensor Data: This is the most direct data source. Information from Motor-Driven Roller (MDR) sensors, photo-eyes, and weight sensors provides a real-time picture of conveyor load, speed (m/s), and item spacing (mm).
- Warehouse Control System (WCS) Data: The WCS directly manages the automation equipment. It provides crucial context on routing decisions, sortation commands, and error rates at specific divert points or junctions.
- Warehouse Management System (WMS) Data: The WMS contains the "why" behind the physical flow. It holds information about incoming order waves, item characteristics (size, weight), order priority, and destination docks. For a deeper dive into how these systems interact, see our guide on WMS, WCS, and WES integration.
- Maintenance Records (CMMS): Data from a Computerized Maintenance Management System on past equipment failures, component replacements, and scheduled maintenance provides patterns that can predict future downtime.
Comparing Predictive Models for Conveyor Systems
Not all predictive models are created equal. The choice of model depends on the complexity of the conveyor system, the available data, and the desired level of accuracy. Simple systems may benefit from straightforward models, while complex sortation hubs require more sophisticated machine learning approaches.
| Model Type | Description | Complexity | Typical Use Case | Estimated Accuracy |
|---|---|---|---|---|
| Linear Regression | Simple model that finds a linear relationship between input variables (e.g., order volume) and throughput. | Low | Basic throughput forecasting for a single, straight conveyor line. | 70-80% |
| Time Series Analysis (e.g., ARIMA) | Uses historical throughput data to identify trends, seasonality (e.g., daily peaks), and patterns to forecast future values. | Medium | Predicting daily or hourly peaks in a distribution center with regular, repeating patterns. | 80-90% |
| Machine Learning (e.g., Random Forest) | A complex model that can analyze non-linear relationships between dozens of variables (sensor data, WMS orders, weather). | High | Complex sortation systems with multiple inputs, outputs, and dynamic routing. | 90-98% |
A Practical Framework for Implementation
Implementing a predictive throughput model is a structured process. While the technical details can be complex, the strategic steps are straightforward:
- Data Aggregation & Cleaning: Consolidate data from sensors, the WMS, and WCS. Ensure data is clean, standardized (e.g., all weights in kg), and complete. This is often the most time-consuming step, taking up to 60% of the project time.
- Model Development & Training: Select an appropriate model and train it on your historical data. For instance, use the last 12-24 months of operational data to teach the model how order volumes on a Black Friday relate to conveyor motor amperage and eventual throughput.
- Real-Time Integration & Validation: Integrate the trained model with your live operational data streams. Run it in a "shadow mode" first, comparing its predictions to actual outcomes to validate accuracy before it goes live.
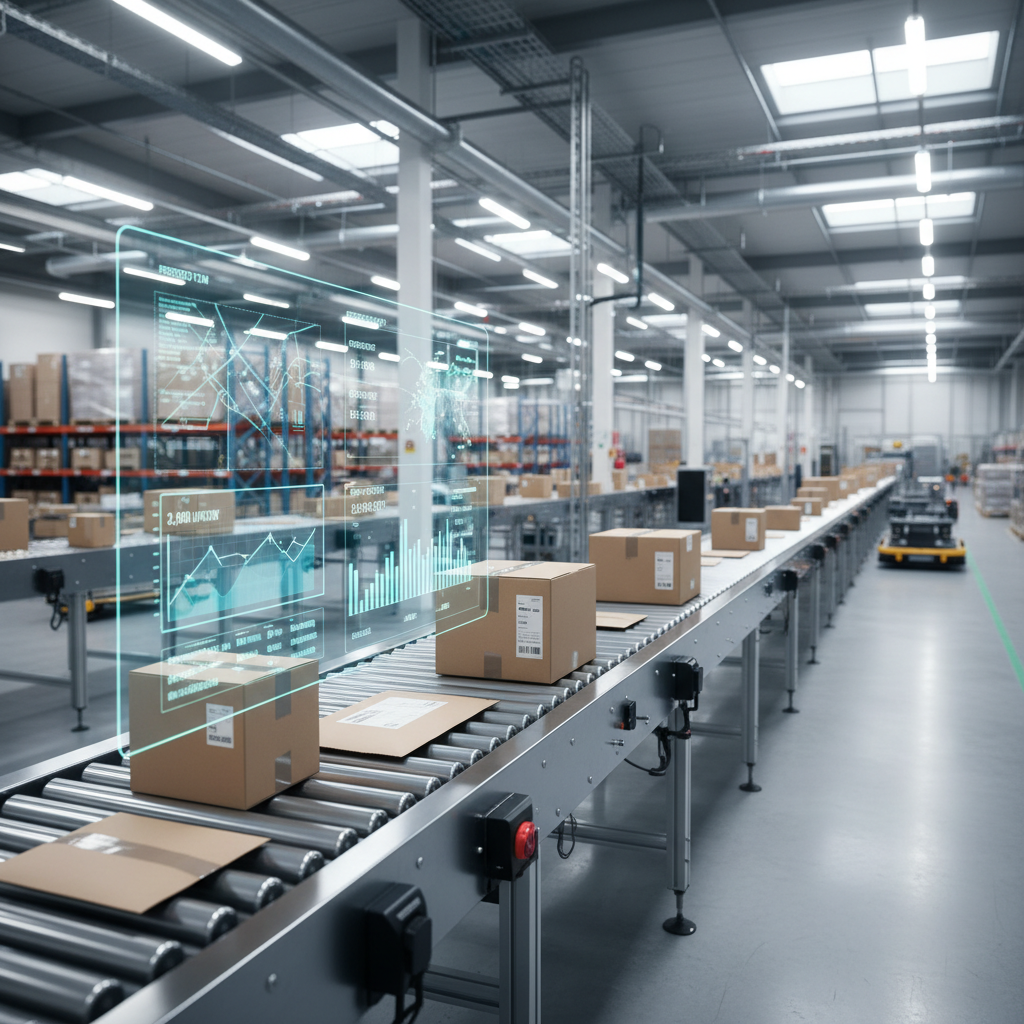
- Deployment & Continuous Improvement: Deploy the model to a live dashboard for your operations managers. The model should continuously retrain itself with new data to adapt to changes in order patterns, system wear, or new product introductions.
The Financial Impact: ROI of Predictive Throughput Analysis
The return on investment (ROI) for predictive analytics is compelling. Consider a mid-sized Benelux e-commerce facility processing 50,000 orders per day. A 1-hour unexpected conveyor downtime during a peak wave can cost upwards of €25,000 in delayed orders and overtime labor. Predictive maintenance, guided by analytics, can reduce such downtime by 30%. More importantly, optimizing flow can increase overall throughput by 15-20%, which for our example facility could mean processing an extra 7,500 orders per day with the same hardware. This enhanced capacity avoids or postpones the need for multi-million-euro investments in new conveyor hardware. As noted in our analysis on why business processes must scale with growth, scaling intelligence is often more effective than just scaling hardware. For those considering new hardware, our Roller Conveyor Guide offers foundational knowledge on system selection.
The Future: AI and Autonomous Adjustments
The next frontier is moving from prediction to autonomous action. In the near future, AI-driven predictive models will not just alert a manager to a potential bottleneck; they will autonomously adjust the system to prevent it. For example, an AI could temporarily slow down a specific upstream conveyor section by 5% to create a buffer ahead of a predicted surge at a merge point. This is achieved by the predictive model communicating directly with the system's PLC (Programmable Logic Controller), making micro-adjustments in real-time faster and more precisely than a human operator ever could.
Easy Systems: Your Partner for a Predictive and Efficient Warehouse
Implementing predictive analytics requires a deep understanding of both data science and the physical mechanics of conveyor systems. At Easy Systems, we fuse these two worlds. We don't just design and build robust, modular conveyor systems; we engineer them with the data infrastructure necessary for modern analytics. Our expertise in WCS integration and sensor technology ensures that from day one, your system is ready to generate the high-quality data needed for powerful insights. We partner with Benelux distribution centers to build not just conveyors, but intelligent, future-proof material handling solutions that drive efficiency and growth.
This article is part of the Conveyor-Design knowledge hub, edited by Easy Systems engineers who design conveyor and warehouse automation systems across the Benelux every week.
Frequently asked questions
What is the primary goal of predictive analytics for conveyor throughput?+
The main goal is to accurately forecast the volume of goods a conveyor system can handle over a specific period, allowing logistics managers to proactively identify potential bottlenecks, schedule maintenance, and optimize resource allocation to prevent slowdowns and maximize efficiency.
How much can a Benelux warehouse improve throughput with predictive analytics?+
While results vary, distribution centers in the Benelux can typically expect a 15-20% increase in effective throughput. This is achieved by minimizing unplanned downtime, smoothing out peak-hour flows, and optimizing labor allocation around the predicted conveyor capacity.
What kind of data is needed for these predictions?+
Effective models require a combination of data: real-time sensor data from the conveyor (e.g., motor amperage, speed, weight), historical performance data, order information from the Warehouse Management System (WMS), and maintenance logs (CMMS).