From Downtime to Flow: Predictive Analytics for Benelux Conveyors
Predictive analytics turns raw conveyor data from sensors into forecasts of potential failures. This allows warehouses in the Netherlands, Belgium, and Luxembourg to schedule maintenance proactively, avoiding costly downtime and ensuring operational continuity.

In the high-stakes logistics landscape of the Benelux, where every second counts, an unexpected conveyor stoppage isn't just an inconvenience—it's a critical failure that can halt an entire operation. As warehouses in hubs like Venlo, Antwerp, and Rotterdam push for greater speed and efficiency, the reliance on reactive maintenance is becoming a liability. The solution lies not in faster repairs, but in preventing failures altogether through the power of predictive analytics.
Definition
Predictive analytics for conveyor systems is the practice of using data from sensors and operational logs, combined with machine learning algorithms, to identify patterns and predict potential equipment failures before they happen. This data-driven approach allows for proactive maintenance scheduling, transforming maintenance from a reactive cost center into a strategic tool for ensuring operational continuity.
The True Cost of Downtime in Benelux Logistics
Unplanned downtime is devastatingly expensive. For a medium-sized distribution center in Belgium or the Netherlands, the cost of a single hour of halted operations can range from €10,000 to over €50,000, depending on the scale and time of year. This isn't just about lost productivity; it's a cascade of failure impacting order fulfillment deadlines, Service Level Agreements (SLAs), and ultimately, customer satisfaction. In an e-commerce context, where next-day or even same-day delivery is the standard, a two-hour stoppage on a main sortation line can mean thousands of missed delivery windows, directly damaging brand reputation and OTIF (On-Time In-Full) scores.
How Predictive Analytics for Conveyors Works
Moving from a "fix-it-when-it-breaks" model to a predictive one involves a clear, three-stage process. It's about creating a conversation with your machinery, where data is the language.
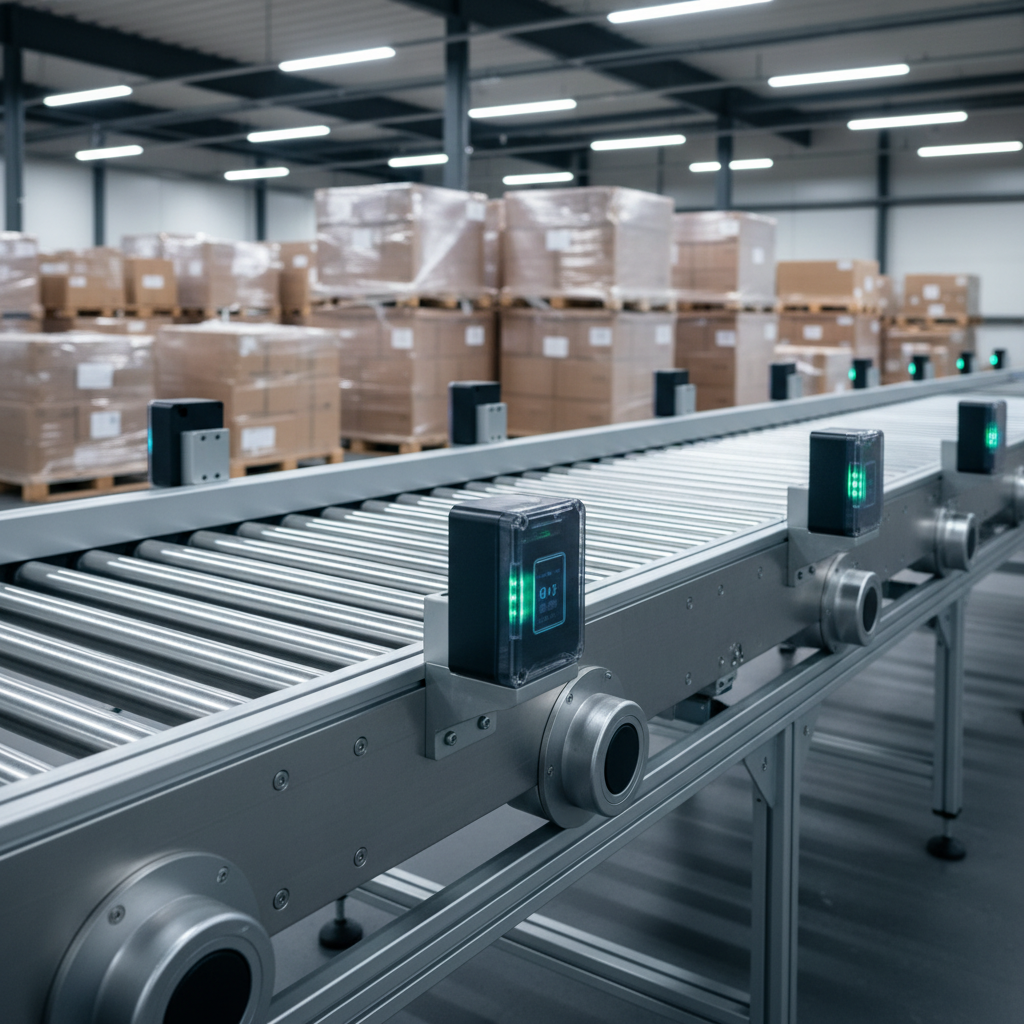
Data Collection: The Sensing Layer
The foundation of any predictive strategy is high-quality data. Modern conveyor systems can be equipped with a variety of sensors that act as a nervous system for your operation. These typically include vibration sensors on motor gearboxes (measuring velocity in mm/s), temperature sensors on bearings, and current sensors monitoring power consumption (kWh) of drive motors. Even acoustic sensors can be used to detect changes in sound patterns that indicate wear and tear on components like rollers or belts.
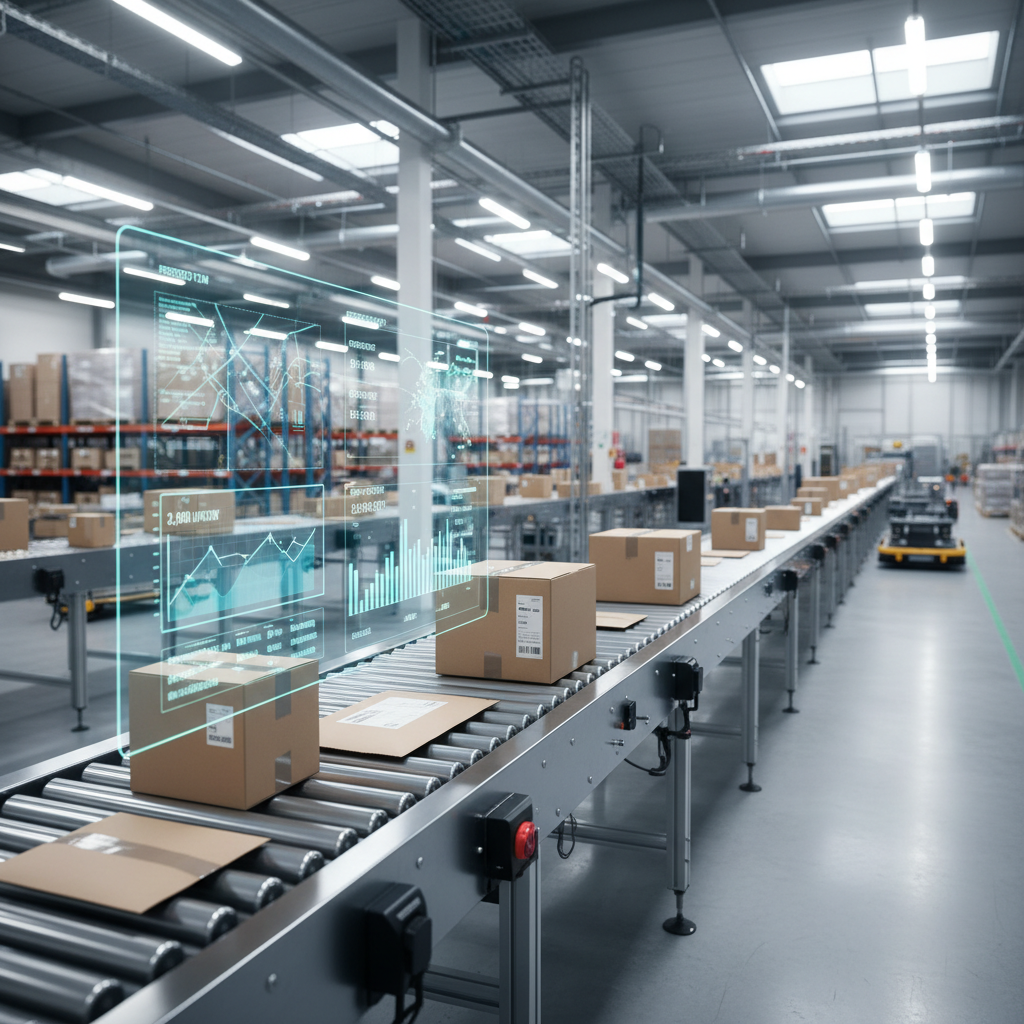
Data Analysis: The Intelligence Layer
Raw data is just noise. The magic happens when this data is fed into an analytics platform. Using machine learning algorithms, the software establishes a baseline of "normal" operation. It then constantly monitors the live data stream for anomalies and subtle deviations from this baseline. For example, a gradual increase in motor vibration combined with a slight rise in temperature might be flagged as a precursor to bearing failure, predicting a breakdown 4 to 6 weeks before it would have occurred.
Actionable Insights: The Decision Layer
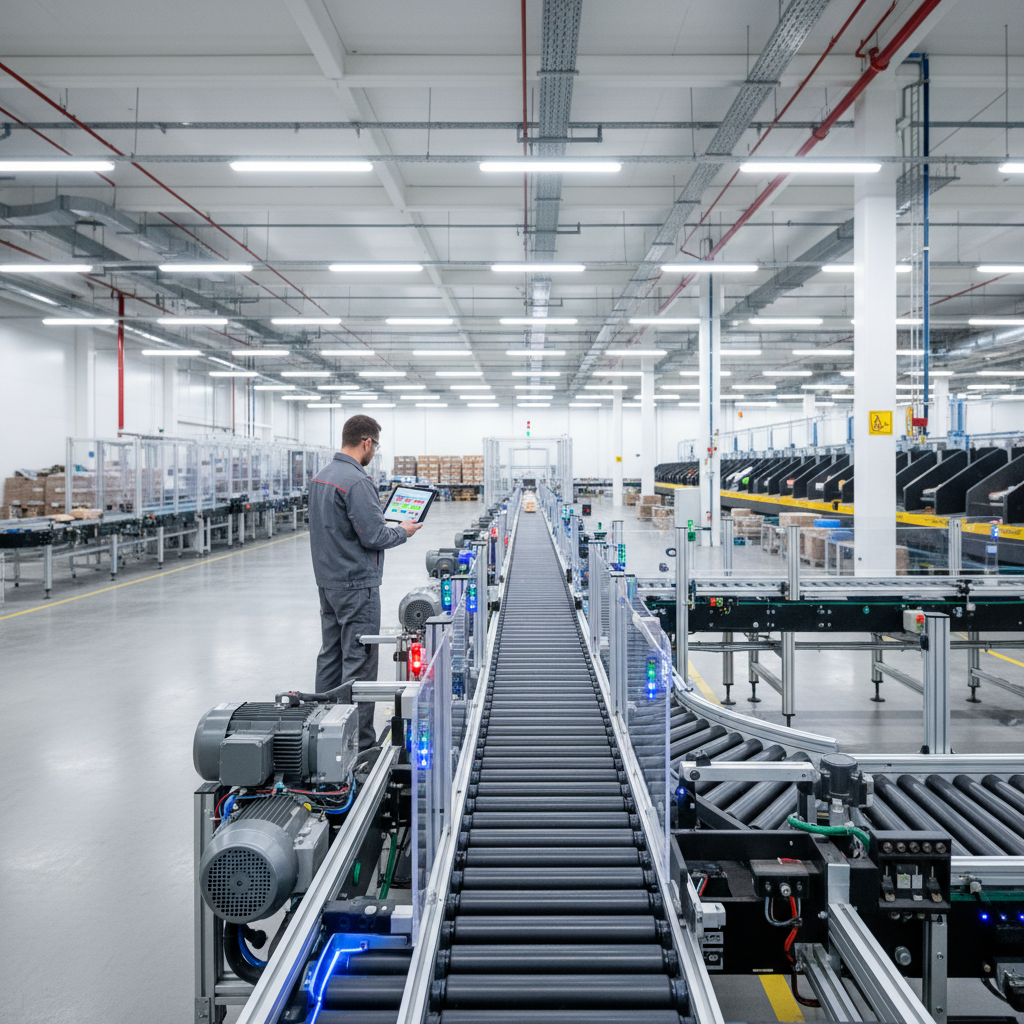
The final step is translating predictions into action. The system doesn't just say "a problem is coming"; it provides specific, actionable alerts. A maintenance manager receives a notification on a dashboard or mobile device: "Warning: Motor on sortation line B4 shows 85% probability of bearing failure within 300 operating hours. Recommended Action: Schedule replacement during next planned maintenance window." This allows for scheduled, non-disruptive intervention, ordering parts in advance, and allocating technicians efficiently.
Key Data Points for Conveyor Health Monitoring
To build a robust predictive model, focus on monitoring a core set of critical indicators. These provide the most valuable insights into the health of your conveyor systems:
- Motor Vibration: Measured in mm/s, this is a primary indicator of bearing wear, misalignment, or imbalance.
- Bearing Temperature: A consistent temperature above 60-70°C often signals lubrication issues or imminent failure.
- Power Consumption (Amperage): Spikes or gradual increases in the current drawn by a motor can indicate increased friction from a failing component or a tensioning issue on a belt conveyor.
- Throughput Rates: A drop in the cases per hour (CPH) measured by sensors can indicate belt slippage or motor issues, often captured by the WCS.
- PLC Error Codes: While often used reactively, logging and analyzing PLC error frequency can reveal recurring issues that point to a developing hardware problem.
Reactive vs. Preventive vs. Predictive Maintenance: A Comparison
Understanding the value of predictive analytics becomes clearer when compared to traditional maintenance strategies. Each approach has a different impact on cost, uptime, and resource management.
| Metric | Reactive Maintenance ("Fix when broken") | Preventive Maintenance ("Time-based") | Predictive Maintenance ("Condition-based") |
|---|---|---|---|
| Approach | Repair after failure occurs. | Scheduled inspections and part replacements based on fixed time intervals or runtime hours. | Maintenance performed when data indicates imminent failure. |
| Cost | Very high (overtime labor, rush shipping for parts, operational losses). | Medium (includes replacing parts that may still be functional). | Optimized (minimal downtime, just-in-time parts, efficient labor). |
| Unplanned Downtime | Highest | Low | Near-zero |
| Asset Lifespan | Reduced due to catastrophic failures. | Good, but not optimized. | Maximized by avoiding failures and unnecessary replacements. |
Implementing Predictive Analytics: A Phased Approach for Benelux Warehouses
Adopting predictive maintenance doesn't require a complete overhaul overnight. A strategic, phased implementation minimizes risk and maximizes ROI.
Phase 1: Audit, Strategy, and Pilot Project
Start small. Identify the most critical component in your entire system—perhaps a high-speed merge or a spiral conveyor handling 100% of your outbound volume. Conduct a data audit: what information is already being generated by your PLCs and sensors? Retrofit this critical section with additional sensors if needed. The goal is a small-scale pilot project with a budget of €5,000 - €10,000 to prove the concept and demonstrate a clear ROI within 6 months.
Phase 2: Full-Scale Integration with WCS and ERP
Once the pilot is successful, expand the sensor network across all critical conveyor lines. The key in this phase is integration. The predictive analytics platform should communicate seamlessly with your Warehouse Control System (WCS) to correlate physical events with operational data. A comprehensive overview of how these systems interact can be found in our guide to WMS, WCS, and WES integration. For example, by integrating with the WCS, the system can understand which specific orders are affected by a potential slowdown, allowing for proactive rerouting.
Phase 3: Continuous Improvement and Scaling
Predictive analytics is not a "set it and forget it" solution. The machine learning models become more accurate over time as they gather more data. In this phase, the focus is on refining algorithms, expanding the system to less critical conveyors, and integrating with other business processes. As many Benelux companies have discovered, as a business grows, its processes must evolve with it; scaling your maintenance strategy is a critical part of that evolution. This continuous improvement loop is what turns a project into a core business competency.
Why Partner with Easy Systems for Your Automation Journey
Transitioning to a data-driven maintenance strategy requires more than just software; it demands a deep understanding of both material handling hardware and the digital ecosystem that controls it. At Easy Systems, we design and build modular conveyor solutions with data and connectivity at their core. Our systems are engineered for easy integration with modern sensors and analytics platforms, providing the clean, reliable data stream necessary for effective predictive maintenance. We don't just sell conveyors; we provide a foundation for intelligent automation. By partnering with us, you gain a collaborator with extensive experience in the Benelux logistics market, ready to help you design a system that is not only efficient from day one but also prepared for the predictive, data-driven future of warehouse management. We help you move from fighting fires to proactively ensuring the continuous flow of goods, turning your material handling system into a true competitive advantage.
This article is part of the Conveyor-Design knowledge hub, edited by Easy Systems engineers who design conveyor and warehouse automation systems across the Benelux every week.
Frequently asked questions
What is the first step to implement predictive maintenance for conveyors?+
Start with a data audit to understand what data your current PLCs, sensors, and WCS collect. Then, identify the most critical conveyor section—like a primary sortation line—and launch a small-scale pilot project to prove the concept and ROI before a full-scale rollout.
How much does predictive maintenance for conveyors cost in the Benelux?+
Initial investment for a medium-sized facility, including sensors, software, and integration, typically ranges from €15,000 to €50,000. The return on investment is usually realized within 12 to 18 months through significantly reduced downtime and optimized maintenance schedules.
Can you apply predictive analytics to older conveyor systems?+
Absolutely. Older, mechanically sound systems can be retrofitted with modern, non-invasive sensors for vibration, temperature, and power consumption. The data from these sensors is then fed into an external analytics platform, enabling predictive capabilities without needing to replace the entire conveyor line.