How Data Analysis Boosts Conveyor Performance in Benelux
Leveraging data from sensors and PLCs allows warehouses in the Benelux to shift from reactive to predictive conveyor maintenance. This guide explores how data analysis optimizes performance, reduces costs by up to 30%, and increases OEE, with practical examples from the region.
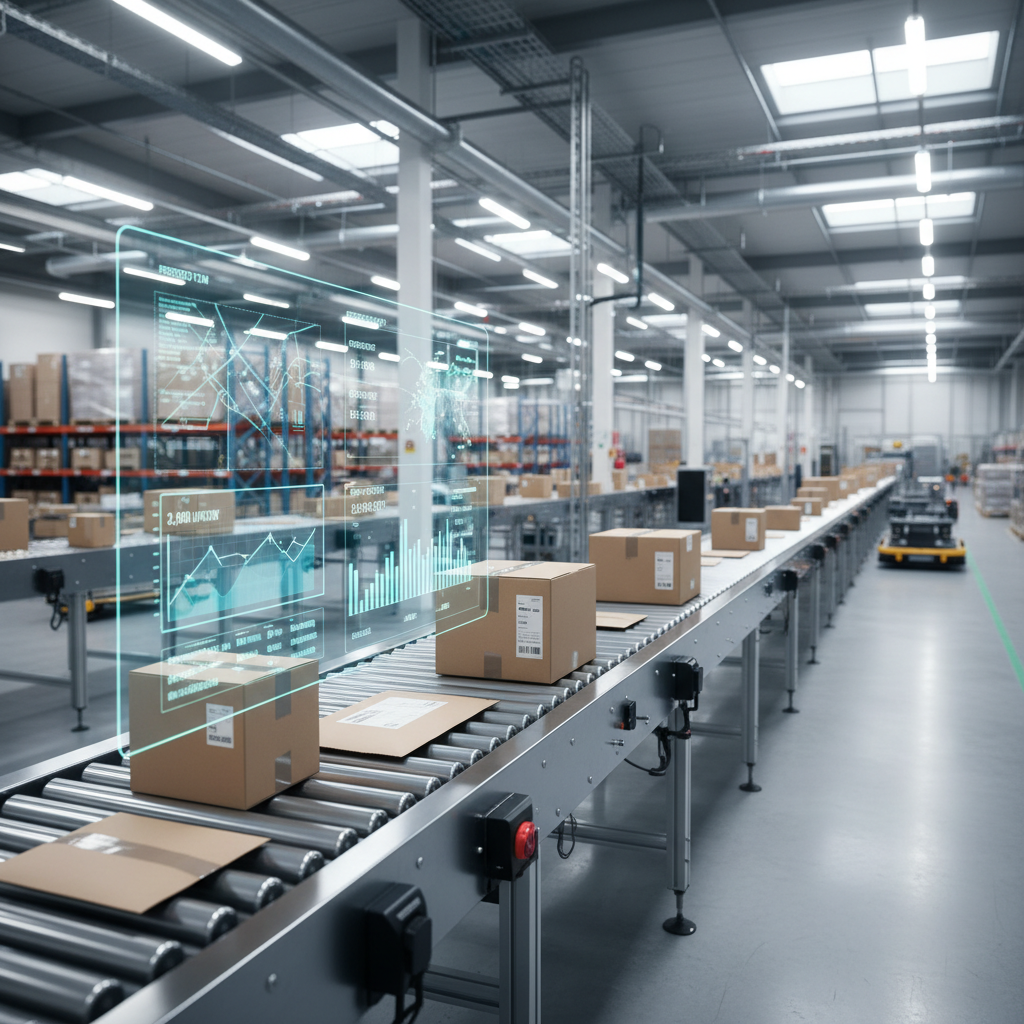
In the fast-paced logistics hubs of the Benelux—from the Port of Antwerp to the distribution corridors around Venlo—conveyor systems are the arteries of any modern warehouse. Their constant, reliable operation is non-negotiable. But what if you could predict a motor failure before it halts your entire sorting line during peak season? This is where data analysis comes in, transforming conveyor maintenance from a reactive, costly fire-fight into a proactive, strategic advantage that drives efficiency and profitability.
Definition
Conveyor Performance Data Analysis is the method of collecting, processing, and interpreting real-time and historical data from conveyor systems—sourced from sensors, motors, and the PLC—to optimize efficiency, predict maintenance needs, and reduce operational downtime. It forms the foundation of predictive maintenance and Industry 4.0 in logistics.
From Reactive to Predictive: A Paradigm Shift in Maintenance
For decades, many warehouse managers in Belgium, the Netherlands, and Luxembourg operated on a "run-to-failure" or, at best, a scheduled preventive maintenance model. Maintenance was performed based on fixed time intervals or after a breakdown had already occurred, causing significant disruption, costly emergency repairs, and potential damage to customer trust through missed delivery slots.
Data analysis flips this model on its head. By continuously monitoring the health of conveyor components, a clear picture of an asset's actual condition emerges. Instead of replacing a motor bearing every 4,000 hours, you replace it when the data shows a consistent increase in vibration and temperature, indicating wear. This shift to condition-based and predictive maintenance is a game-changer for operational resilience.
The Core Data Sources for Conveyor Analysis
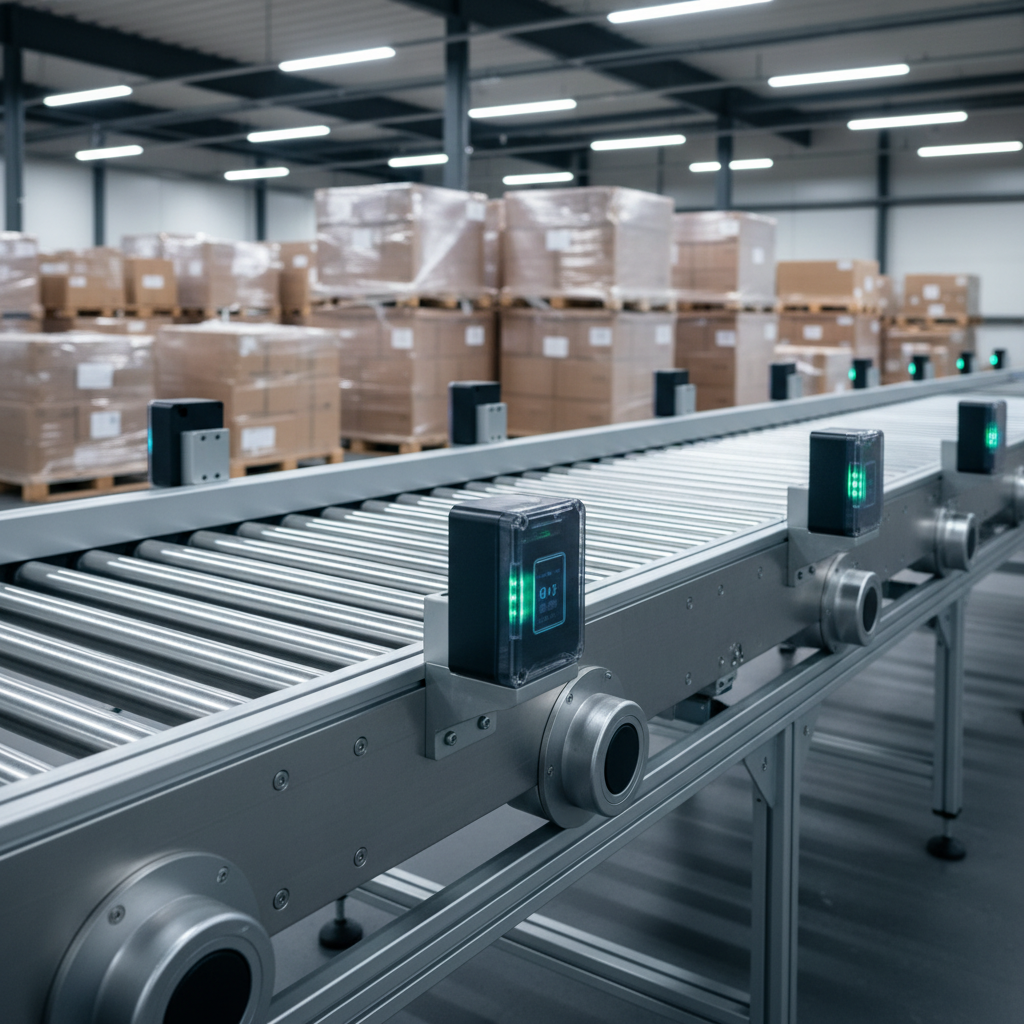
Effective analysis relies on high-quality data. In a modern conveyor system, this data is collected from several key sources:
- Electric Motors: Monitoring current (Amps) and power consumption (kW). A spike in current draw on a belt conveyor motor might indicate increased friction from a failing bearing or an overtensioned belt.
- Vibration Sensors: Attached to motor housings, gearboxes, and critical bearing points. These sensors can detect subtle changes in vibration frequencies that are precursors to mechanical failure.
- Temperature Sensors: Measuring the heat of motors and bearings. A steady rise in temperature is a classic indicator of impending failure due to friction or lubrication issues.
- Photo-Eyes & Barcode Scanners: While primarily for tracking goods, the data on throughput, item spacing, and read-rate failures provides crucial insights into flow efficiency and potential bottlenecks or jams.
- PLC & WCS Logs: The central Warehouse Control System and Programmable Logic Controllers log every stop, start, jam, and error code, creating a rich history for identifying recurring problem areas.
Case Study 1: E-commerce Hub in Antwerp Reduces Downtime by 70%
A large e-commerce fulfillment center in the Port of Antwerp, handling over 100,000 parcels per day, was plagued by unscheduled downtime on its main sorting line. Breakdowns were costing an estimated €15,000 per hour in lost throughput and labor costs. The primary culprits were failing motor gearboxes on the high-speed sections of their roller conveyors.
The Data-Driven Solution
The company retrofitted 40 critical drive motors with €250 vibration and temperature sensors, feeding data into a cloud analytics platform. The system established a baseline for normal operation within two weeks. Soon after, it flagged two motors showing a gradual increase in high-frequency vibrations. A physical inspection revealed early-stage bearing wear. The maintenance team scheduled the replacement for a planned, low-volume night shift. The cost of this proactive repair was under €2,000. A catastrophic failure during the day would have cost over €50,000 in direct and indirect losses.
Within six months of implementation, unplanned mechanical downtime on the line was reduced by over 70%, and maintenance labor was reallocated from emergency repairs to value-added optimization tasks. As companies grow, their processes must evolve to match. Data-driven maintenance, as seen in this Antwerp example, is a critical step in scaling logistics operations effectively, a challenge many businesses face. You can read more about this common growth pain point in our analysis on how processes must scale with business growth.
Comparative Analysis: Traditional vs. Data-Driven Maintenance
The strategic benefits of adopting data analysis become clear when comparing the approaches side-by-side. The following table outlines the key differences for a typical Benelux distribution center.
| Feature | Traditional Reactive Maintenance | Data-Driven Predictive Maintenance |
|---|---|---|
| Strategy | Fix it when it breaks | Predict and prevent failures based on condition |
| Typical Downtime | High (e.g., 5-10 hours/month) | Low (e.g., <2 hours/month) |
| Maintenance Costs | High (emergency repairs, overtime pay) | 25-30% Lower (planned activities, standard rates) |
| Spare Parts Management | Large, "just-in-case" inventory (€50k+) | Optimized, "just-in-time" inventory (€10k-€20k) |
| Equipment Lifespan | Shorter due to catastrophic failures | Extended by 20-40% through proactive care |
| Operational Impact | Significant disruptions, missed SLAs, chaos | Minimal impact, scheduled during off-peak hours |
Case Study 2: Dutch Flower Auction Boosts Throughput with Motor Data
At a major flower auction near Aalsmeer, speed is everything. Trolleys of flowers are transported on a vast network of chain and roller conveyors. The system uses hundreds of Motorized Drive Rollers (MDR). The operators noticed intermittent slowdowns and stoppages in certain zones, creating bottlenecks during peak morning auctions. The cause was not immediately obvious.
By analyzing the current draw data from the MDRs, which was already available via the control network, they correlated the slowdowns with specific batches of heavier trolleys. The MDRs in those zones were hitting their torque limits, causing them to slow down or briefly shut off. The "problem" wasn't a failure, but an operational capacity issue. Armed with this data, they rerouted heavier trolley types to a conveyor line equipped with more robust motors, immediately smoothing the flow and increasing peak throughput by 15% without any new hardware investment.
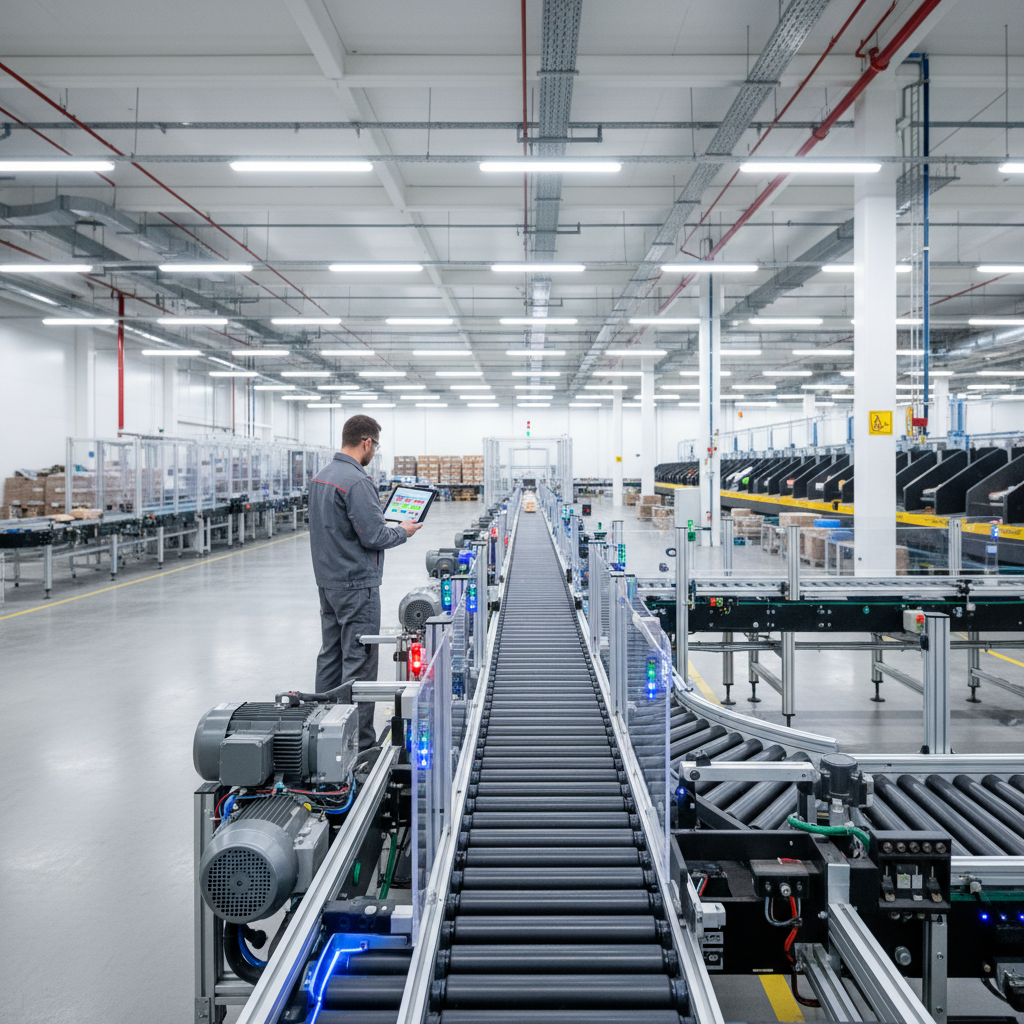
The Role of WMS, WCS, and WES Integration
Conveyor data becomes exponentially more powerful when it is integrated with higher-level software. While sensor data tells you the *health* of the hardware, integrating it with a Warehouse Control System (WCS) or Warehouse Execution System (WES) provides context. For a deep dive into how these systems interact, see our guide on WMS, WCS, and WES integration.
This integration allows you to answer more complex questions:
- Is the low throughput on line 3 due to a mechanical issue or a shortage of incoming parcels from the picking area? (WMS + Conveyor Data)
- Can we dynamically route packages around a conveyor section that is showing early signs of motor strain? (WES + Sensor Data)
- Does the accumulation zone jam at the same time every day, and does this correlate with a shift change? (WCS + HR Data)
This holistic view transforms the warehouse from a set of disconnected silos into a single, intelligent, and self-optimizing ecosystem.
Why Easy Systems is Your Partner for Data-Driven Conveyors
At Easy Systems, we don't just build conveyors; we design, manufacture, and integrate intelligent material handling solutions for the European market. Our modular conveyor systems are designed with data in mind, incorporating high-quality motors and readily accessible connection points for sensors. We understand that modern logistics in the Benelux and beyond requires not just robust hardware, but also the intelligence to run it optimally.
Our engineering team works with you to identify critical points for data collection and helps integrate conveyor performance metrics into your existing WCS or ERP systems. We provide the robust foundation and technical expertise to help you transition from a reactive maintenance model to a proactive, data-driven strategy. Partner with us to build a conveyor system that is not only powerful and reliable but also intelligent and ready for the future of logistics.
This article is part of the Conveyor-Design knowledge hub, edited by Easy Systems engineers who design conveyor and warehouse automation systems across the Benelux every week.
Frequently asked questions
What data is most important for conveyor analysis?+
Motor current, vibration, temperature, belt speed, and throughput data (parcels per hour) are critical. This data, collected from sensors and the <a href=\"/glossary#plc\">PLC</a>, provides a comprehensive view of conveyor health.
How much does it cost to implement data analysis for conveyors?+
Initial setup costs vary from €5,000 for a basic sensor package on a critical line to over €100,000 for a plant-wide integrated system. However, the ROI is typically seen within 12-18 months through reduced downtime and maintenance savings.
Can you apply data analysis to older conveyor systems?+
Yes. Retrofitting older systems with modern sensors and data gateways is a common and effective practice. While new systems with integrated sensors are ideal, a well-planned retrofit can deliver 80% of the benefits for a fraction of the cost of a full replacement.
What is the difference between preventive and predictive maintenance?+
Preventive maintenance is time-based (e.g., replace a part every 6 months), regardless of its condition. Predictive maintenance is condition-based; it uses real-time data to predict when a part will fail and schedules maintenance just before that happens, maximizing component lifespan and reducing costs.